The SaaS Dashboard Every Leader Need to Dominate in 2023
A Saas dashboard is an essential tool when planning the trajectory of your business. Sage Intacct provides you with SaaS intelligence to monitor the success and growth of your business over time. It is a complete, pre-configured SaaS dashboard overviewing financial reporting and important SaaS metrics of different areas such as retained revenue, audit, cash, growth, product, retention, and unit economics.
This accounting software provides powerful report visualizations that are ready for export or to be shared in real-time through email, or on the cloud. You can archive copies that are safely kept inside Sage Intacct or published into a cloud platform of your choice. Save up to 40 hours per month on reporting and cut time on checking data accuracy by 75% in 2023 and beyond with Sage Intacct.
To learn more, download: Sage Intacct SaaS Intelligence
Cash Dashboard Overview
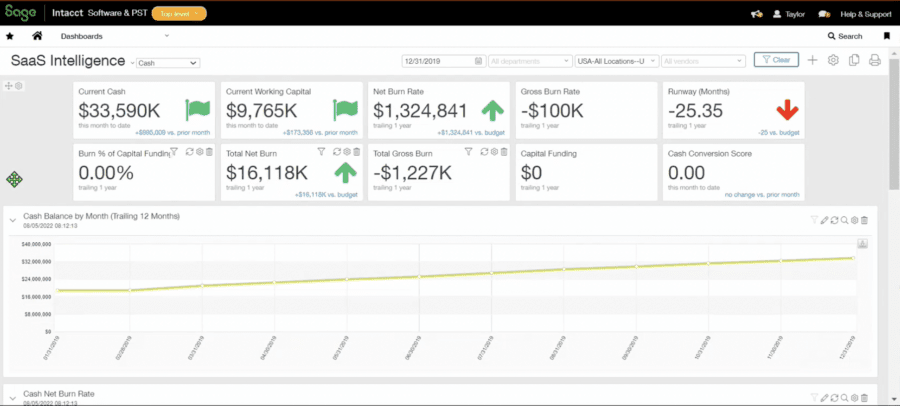
Cash is king. Sage Intacct’s SaaS dashboard is proficient in tracking cash inflows and outflows, monitoring working capital, and getting a graphical representation of cash balances by using trailing 12 months.
The reporting experience can be tailored for different stakeholders by controlling who sees real-time reports and who sees period-end views. You can leverage dimensional tagging, filter on a dashboard view, and export additional trends and insights when analyzing records. These features will help you determine what matters most to your business and its stakeholders.
Once your team is comfortable with the positive cash inflows and all the outflows are on track, you can then monitor how well your business is retaining customers.
An overview of the Cash section inside Sage Intacct’s SaaS Dashboard.
Retention Dashboard Overview
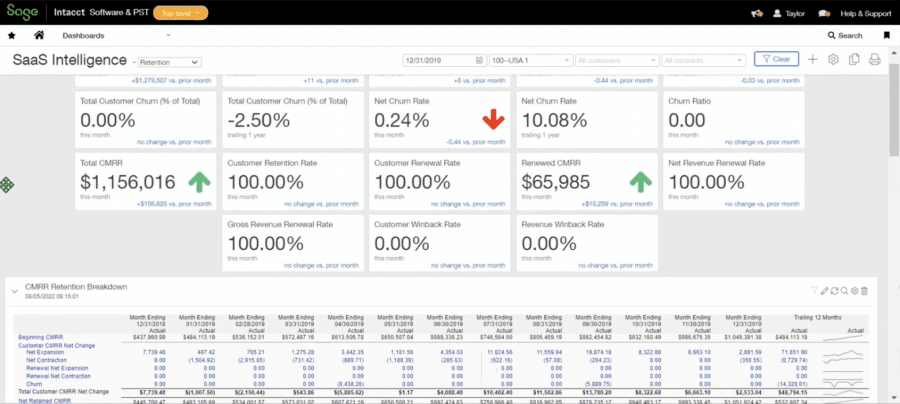
The retention category on the dashboard provides a detailed overview of how customers interact with the products. You can closely monitor significant SaaS metrics like the churn rate and understand the retention rate of the business consistently.
Your team can further learn more about the relationship with each client; are the contracts expanding, are they contracting over time, are there upsells, or any additional add-ons coming into place as a part of the contract lifecycle? These are important questions to ask when evaluating your retention strategy to better enhance it.
An overview of the Retention section inside Sage Intacct’s SaaS Dashboard
Growth Dashboard Overview
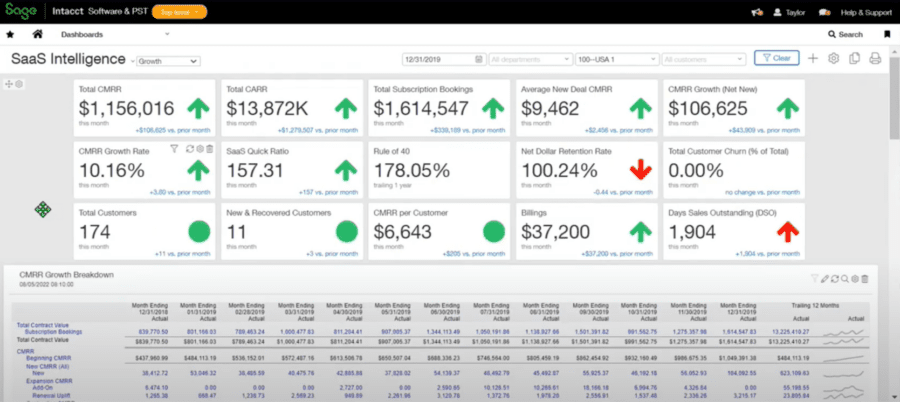
After retaining customers, you may want to acquire new organizations to leverage the existing platform and services. The growth section does a tremendous job of monitoring the company’s expansion. It has the ability to track quick ratios, the rule of 40s (the combined growth rate and profit margin should be equal or greater than 40%), and dive deep into detail within different dashboard views including the General Ledger report. This report gives you access to transaction records that can support you when communicating the trends you’re seeing on the dashboard. These SaaS metrics will help you tell a story behind the numbers with actual transaction records to refer to when communicating with executives and investors.
An overview of the Growth section inside Sage Intacct’s SaaS Dashboard.
3 reasons why Sage Intacct
With Sage Intacct, you can drive that data-driven report by telling the story of your business over time with SaaS metrics at the tip of your fingers, all in real-time. It is the leading platform for B2B subscription management for three main reasons:
- Sage Intacct’s average ROI comes in 19 months, compared to 30 months with other similar products;
- Sage Intacct’s average implementation time is three months. It takes 2x longer to implement competitors.
- Sage Intacct’s ease of use for doing business is 20% higher.
Technologies are rapidly changing the way businesses communicate internally and externally. Dominate your market in 2023 by improving your workflow and uniquely positioning your business more agilely than your competitors. Propel your business forward and schedule a demo today!


